Gasoline prices are one of the most visible economic costs for American households, making the price at the pump a frequent subject of political debate.
Historical data from the U.S. Energy Information Administration show that national gasoline prices have experienced significant peaks during several different presidential administrations.
What the Historical Numbers Show
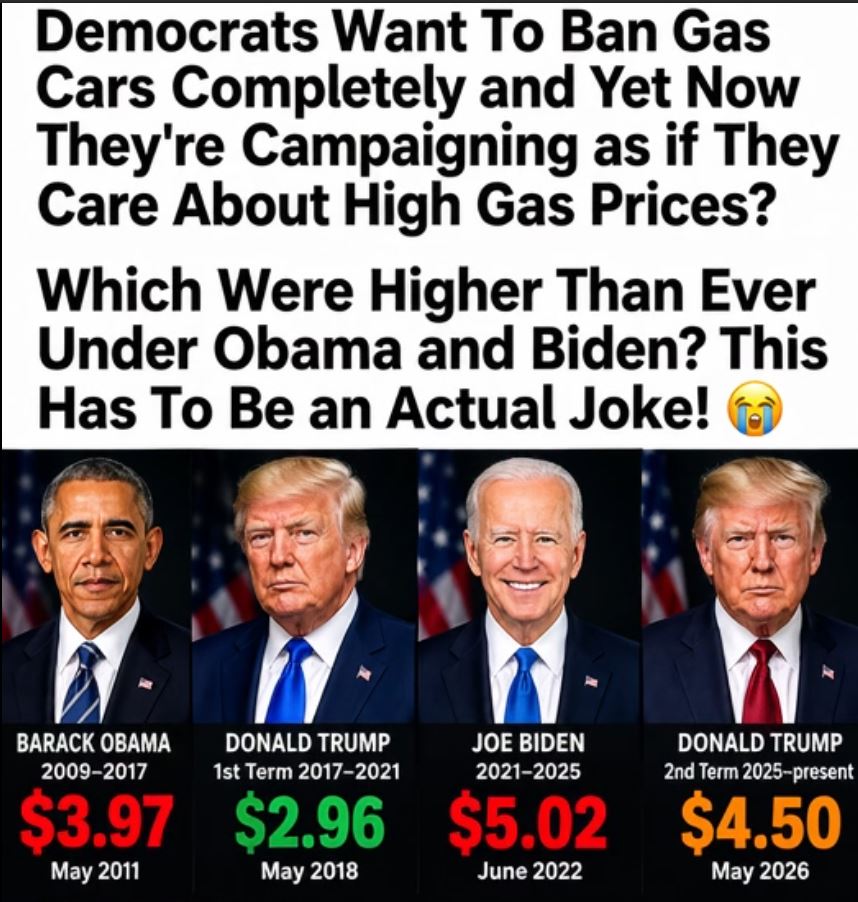
In 2011, the national average price for regular gasoline reached a weekly high of $3.97 per gallon on May 9.
The annual average that year was $3.52 per gallon.
In 2018, the national regular-gasoline price reached a peak of $2.96 per gallon on May 28.
The largest recent spike came in 2022. EIA data show that regular gasoline reached approximately $5.01 per gallon in June, while the average for the full year was $3.95.
Gas Prices in 2026
Gasoline prices have risen substantially again in 2026.
The national average for regular gasoline reached $4.50 per gallon during the week of September 7. By September 28, the EIA’s national average was $4.465 per gallon.
The increase has occurred amid major disruptions in global energy markets connected to the conflict involving Iran.
Reuters has reported that supply disruptions, reduced global fuel inventories and instability in international oil markets have contributed to higher gasoline and diesel prices.
Why Presidential Comparisons Are Complicated
It is common to compare gasoline prices under different presidents, but the president does not directly set the national price at the pump.
Gasoline prices are strongly influenced by the global price of crude oil, which is affected by international supply and demand, OPEC+ production decisions, wars, sanctions, refinery disruptions and other events.
Domestic factors also matter.
Refinery capacity, seasonal gasoline formulations, inventories, transportation costs, state and federal taxes, and regional supply conditions can all affect what drivers pay.
Inflation Changes the Historical Comparison
Another important consideration is inflation.
A dollar spent on gasoline in 2011 had greater purchasing power than a dollar spent today. Therefore, comparing only the nominal price shown on the pump does not completely measure how expensive gasoline was for households in different years.
The $3.97-per-gallon peak recorded in 2011 should therefore be considered alongside the overall price level and household incomes at the time.
Energy Production and Policy
Energy policy is part of the broader discussion.
Policies affecting oil and gas production, drilling, refinery operations, vehicle efficiency, environmental requirements and energy infrastructure can influence the supply and demand balance.
However, determining how much any individual policy contributes to the price drivers see at the pump requires accounting for global oil markets and other factors occurring at the same time.
The Broader Picture
The historical record shows several distinct gasoline-price spikes:
2011: $3.97 per gallon
2018: $2.96 per gallon
2022: about $5.01 per gallon
September 2026: about $4.50 per gallon at the September 7 peak
These figures provide useful context, but they should not be interpreted as a simple measure of which administration caused or controlled gasoline prices.
Global energy markets, geopolitical events, inflation, refinery capacity and domestic energy policies all contribute to the price Americans ultimately pay.
Conclusion
Gasoline prices have moved dramatically over the past 15 years, with the 2022 spike remaining above the September 2026 national average.
The current increase is occurring during significant disruption in global energy markets related to the conflict involving Iran.
For consumers, the most important measure remains the actual cost of filling the tank and how that cost compares with household income, inflation and other living expenses.